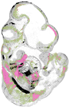
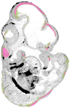
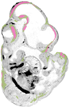
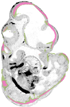
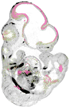
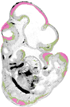
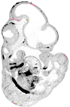
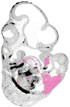
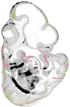
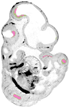
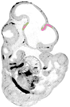
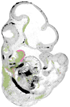
3D Mapping of OPT Gene Expression Patterns
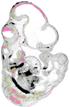
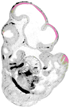
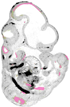
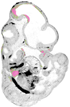
We have developed a technique that allows 3D mapping of gene expression patterns captured using the 3D imaging technique Optical Projection Tomography (OPT). A source OPT expression pattern (coloured components) is mapped onto a reference model (greyscale) and these can be viewed in any plane using the 3D viewer.
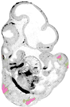
The examples below show various genes in the Wnt signalling pathway.
Click on the thumbnails to show these expression patterns in the 3D viewer.
|
Movie showing various OPTs of Wnt genes (from Dr Paula Murphy) manually warped into the TS17 EMA53 reference model. This illustrates the powerful method by which warping into a common space allows users to discern overlaps and non-overlaps of differing genes. |
 icon to keep this page displayed.)