Data Annotation Methods
Gene expression patterns in EMAGE are described using these methods:
We have also
And we are
For more detailed information than is given here, read our pdf document (5MB) outlining the concept of the EMAGE framework and the logic used in data annotation and querying.
| Text Annotation |
|
In this process, EMAGE curators simply use the EMAP anatomy ontology as a standardised language framework to denote the sites of gene expression, based on the authors own words. This converts the unstructured free-text description of the author into a standardised and structured description that is available for database storage and query:
 |
|
An example of an EMAGE text annotation.
This example is from EMAGE:47 and shows a WM specimen stained for Shh expression at 9.5dpc (TS15).
The process involves the annotator finding and reading any text-based descriptions associated with the specimen as supplied by the author or data submitter, finding equivalent terms within the EMAP anatomy ontology and then annotating these terms based on the original description.
Associated with each annotated term is a signal strength, pattern and relevant notes. Larger image. |
|
|
| |
|
|
|
| Spatial Annotation |
|
In this process, EMAGE curators use the EMAP virtual embryos as a spatial framework in which to denote the sites of gene expression as seen in the image in the anatomically equivalent correct places. This converts the abstract and unstructured information captured in each image into a spatially standardised description that is available for database storage and query:
|
|
Some examples of EMAGE spatial annotations.
Both wholemount and section examples are shown.
The raw data images are shown on the left-hand column and the resulting spatial annotations, denoted against the EMAP virtual 3D embryos are shown in the right-hand column. Note that for both these data types, the raw data are 2D images.
The colours in the spatial annotations represent apparent strength of signal.
An example movie showing how such a spatial annotation procedure is carried out, can be found below. |
|
|
|
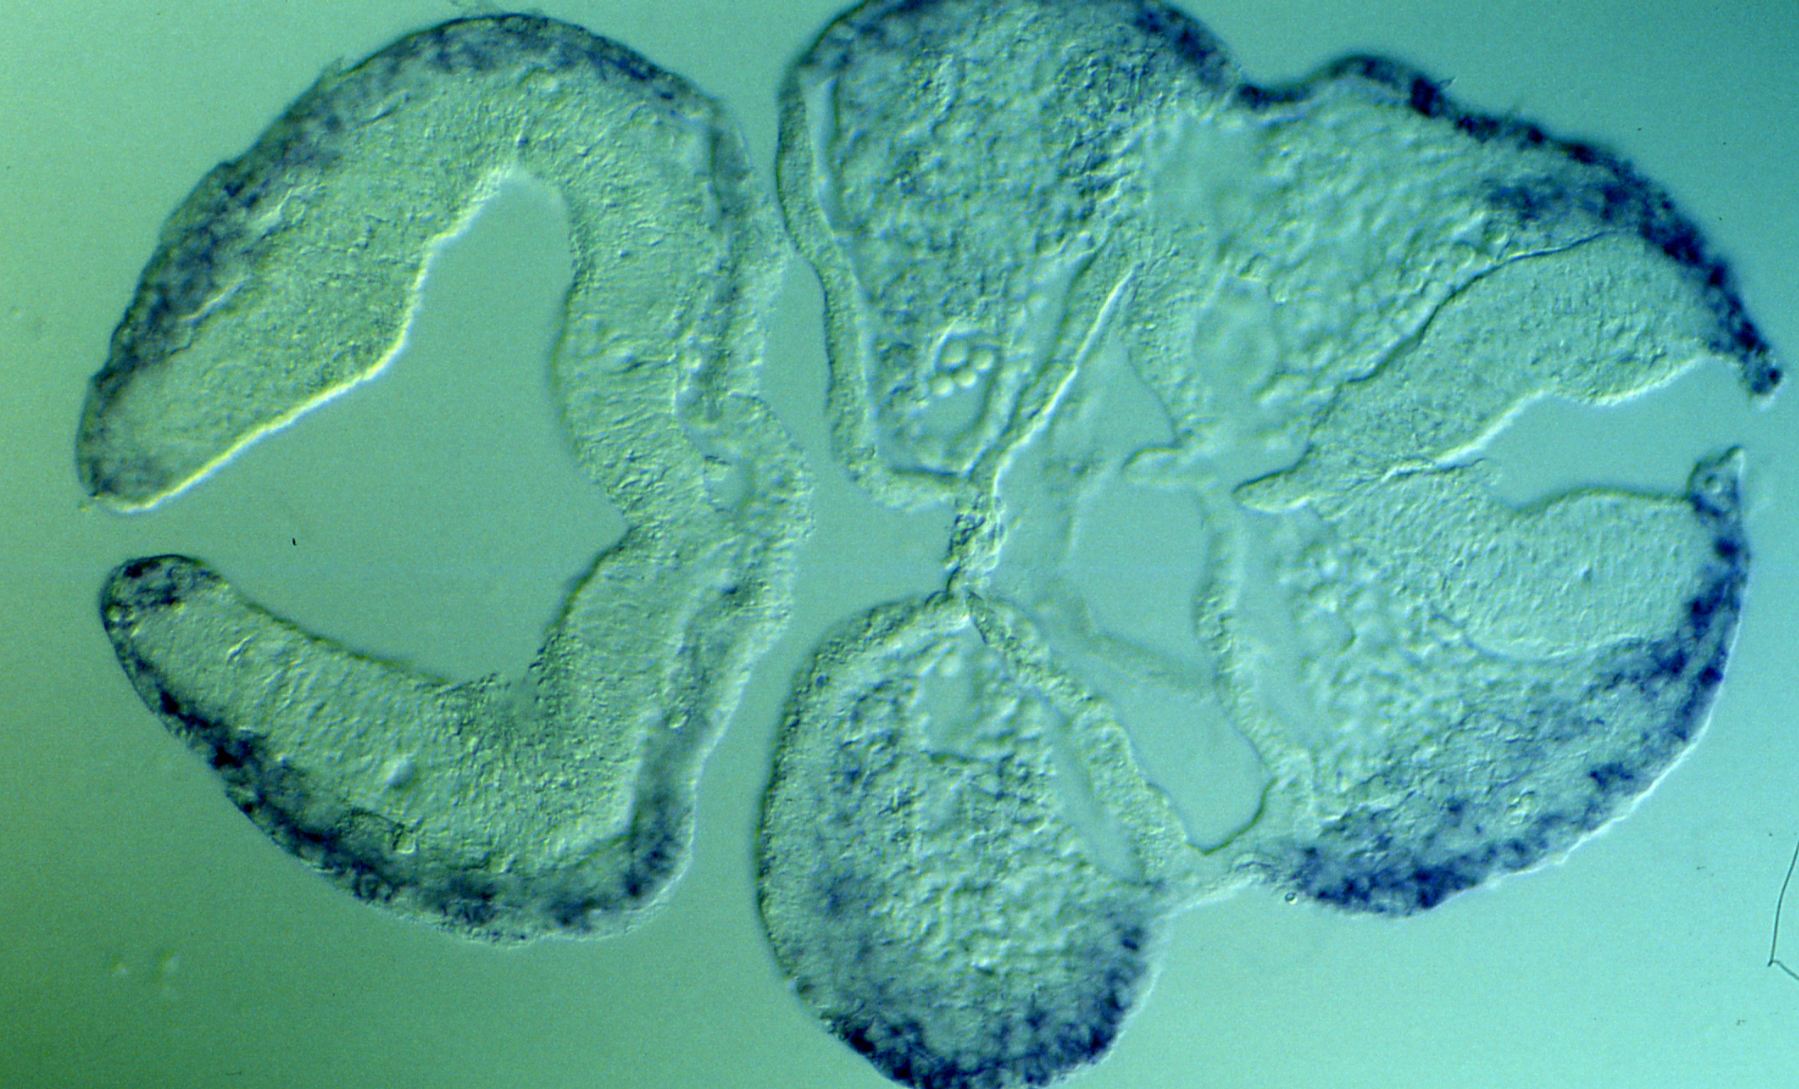
The example shown is from EMAGE:602 and shows a WM specimen stained for Tcfap2a expression at 7.0dpc (TS11). |
|
The spatial annotation process.
The process involves the annotator using a bespoke program called MAPaint and:
- Selecting a target EMAP embryo model that is of the same Theiler Stage as the data embryo.
- Adding anchor points in the two images at anatomically similar places - this directs a 'warp' of the data image over the target EMAP model embryo.
- Extracting signal from the data image according to various levels of signal intensity, and then transferring these to the model, using the warp parameters from the previous step as a guide to place these regions in the corresponding places on the target.
- The colours in the spatial annotations represent apparent strength of signal.
- This process can be performed between any two 2D images i.e. one wholemount stained embryo to a wholemount view of the target model (as shown in this example) or a single 2D section stained for gene expression to a corresponding 2D section taken from the target model.
- During this process, EMAGE curators also assign confidence scores relating to the clarity of pattern seen, and the morphological match between each data embryo and the corresponding EMAP virtual model used as the spatial template during this process.
- Full instructions on how to perform a spatial annotation using MAPaint can be downloaded in pdf format for wholemount (4.3MB) or section (9.7MB) data. The example images used in these documents are sox10.jpg and AP2.jpg.
|
|
|
| |
|
|
|
Text Annotation automatically
inferred from a Spatial Annotation |
|
This refers to text annotation that is automatically generated if a spatial annotation (as described above) has been performed within the internal space of one of the EMAP 3D virtual embryos that has anatomy domains delineated within it:
|
|
Text annotation automatically inferred from an EMAGE spatial annotation.
This example is from EMAGE:1265, which describes expression of OTX2 protein at 7.75 dpc. The raw data has been spatially annotated to the EMAP TS11 3D virtual embryo. Regions of protein expression are shown in red and regions where no expression is detected is shown in cyan.
These domains denoting OTX2 expression overlap with 3D anatomy domains in the TS11 virtual embryo model, including those denoting the embryonic ectoderm, embryonic mesoderm and embryonic endoderm. The number of voxels (volumetric pixels) that intersect between the expression domains and each 3D anatomy domain can be calculated. This results in an automated text annotation which is derived directly from the spatial annotation.
Note that other 3D anatomy domains also intersect with the OTX2 expression annotation including the mesoderm and ectoderm of the amnion and the visceral endoderm.
Larger image. |
|
|
|
| |
|
|
|
| Automatic spatial annotation of EURExpress data |
|
We have devised a method to automatically detect both tissue and signal in the ~500,000 image EURExpress dataset and then align the data based on edge-recognition and alignment of the tissue detected on adjacent sections. We then produce projection images through the aligned sections that resemble conventional whole-mounted specimens, and these are aligned to the EMAGE reference embryo model. The apparently signal is aligned and averaged to produce the final annotation.
 |
|
Method for auto-annotation of the EURExpress dataset
A) The EURExpress data. (a) The data consists of sagittally sectioned E14.5dpc embryos that have been assayed using colorimetric ISH. (b) Every 6th section has been assayed for one gene (i.e. nth, n+6th, n+12th section etc.) which results in approximately 24 parallel sections per gene, and 6 genes per embryo. (c) An example image showing the results of ISH for Matn1.
B) Automated signal extraction methods. (a) The example Matn1 raw data image is shown. (b) Discerning between tissue and the glass microscope slide is achieved by sampling the colour values of pixels found at the corners of the image (indicated by the red boxes). RGB colour values outside this range are defined as tissue (as indicated in grey in image c). (d) Detection of signal is achieved by identifying pixels with RGB colour values in the purple/blue range, and these pixels are subsequently extracted from the raw image to produce image e. The signal intensity is divided equally into 10 levels (02.wlz – 11.wlz) and the unstained tissue is denoted as a separate domain (01.wlz). (f) For illustration purposes, the 11 domains are colour coded here in red, yellow, green and cyan as indicated.
C) Generation of an aligned 6 assay ‘pseudo-wholemount’. (a) All contributing sections from one embryo are aligned based on best-fit of adjacent sections to produce one 6 assay ‘pseudo wholemount’ projection image (as shown in image b). The previously defined tissue edges (see Suppl Figure 3Bc) are used in this process.
D) Alignment of the 6 assay ‘pseudo-wholemount’ to the TS23 EMAP standard embryo model is achieved by a semi-automated process requiring user input. (b) 12 ‘tie-points’ in defined positions on the TS23 model (shown in red) are denoted in (a) anatomically equivalent positions in each 6 assay pseudo wholemount image (also shown in red).
E) Alignment and averaging of signal to create an EMAGE spatial annotation per gene/assay. From each 6 assay aligned image stacks (shown in a), relevant images for one assay are removed for both raw data (b) and for the signal level domains extracted from each section (d). These are aligned using both the section-section alignment parameters from section C and the wholemount to TS23 model warp parameters from section D and then averaged to produce projections images c (a representation of a 1-assay pseudo wholemount) and e, the spatial annotation to the TS23 WM model.
This example is from EMAGE:6089
Larger image |
|
|
| |
|
|
|
| Spatial Annotation from 3D images |
|
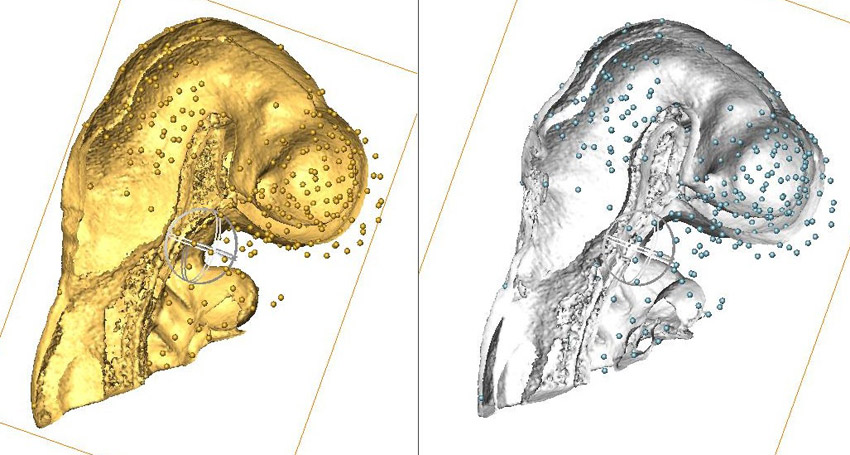
The aim is to perform full 3D spatial alignments between 3D embryo image data generated using Optical Projection Tomography and a stage matched EMAP Atlas virtual embryo. We have explored the utility of the commercial software package AMIRA to achieve this goal for relatively 'rigid' structures such as the mouse embryo head. More recently, the Image Analysis Research Team of the EMAP project has developed the WlzWarp interface that utilses a Constrained Distance Transform to allow 3D spatial warping of whole embryos which are subject to differences in posture (bending and twisting etc).
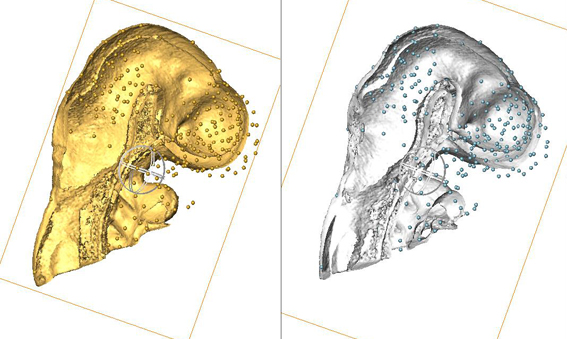 |
Use of AMIRA for full 3D spatial annotation.
This image shows data from a pilot study: the heads from two different embryos - one is an EMAP embryo model and one is an experimental data embryo. AMIRA has been used to manually delineate points of anatomical equivalence in the two heads - these are denoted by the many small balls. These points are used subsequently to anchor data in 3D space when a 3D image warp is applied to the gene expression data from the experimental embryo (the expression domains are not shown in this image), which results in transferral of the expression data from the experimental embryo into the EMAP embryo model embryo (and therefore, the EMAGE database) in an appropriate 3D context. |
|
|
|
| |
|
|
|

 icon to keep this page displayed.)


