Methodology of spatial pattern comparisons and subsequent heirarchical clustering used in EMAGE
- This method allows data in EMAGE (derived from images of in situ gene expression patterns) to be computationally compared for spatial similarities and then clustered into groups that show similar expression patterns.
- Housed in EMAGE are many spatial domains depicting regions of gene expression. These have been derived from input photographs, and annotated to the correct spatial positions within the EMAP virtual embryo models by EMAGE staff and then housed in the EMAGE database. These examples are all wholemount data at TS17:
ID
|
Gene
|
Raw Data Image
|
Spatial Annotation
|
||
Pax6 |
 |
 |
|||
Sox10 |
 |
 |
|||
Dlx5 |
 |
 |
- The different coloured domains in the spatial annotation images can be selected for use in the clustering analysis. These denote regions of strongest, moderate and weakest signal intensity and are shown in red, yellow and blue respectively in the spatial annotations above.
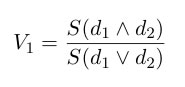
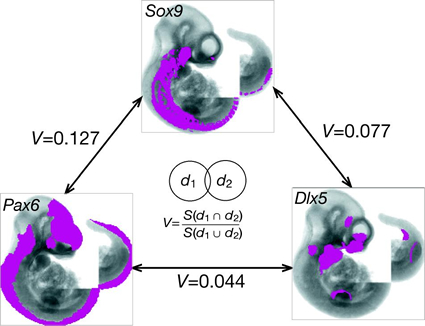
- Similarity measurements are then calculated between every image pair in the selected dataset. Currently we use the Jaccard Index (V) which is defined as the ratio of the shared features of two entities (d1 and d2: in this case the spatial annotation domains of two assays) to the total number of all features in the two entities. It can be expressed as such:
For example, Jaccard Index similarity values of the patterns denoting combined strongest, moderate and weakest signal intensities for the Pax6, Sox10 and Dlx5 examples above would be:
|
||
 |
- The output files from the Jaccard Index pair-wise comparisons are tab delimited .txt files where both columns and rows correspond to the IDs for each assay. In the example below, when a pattern is compared to itself (e.g. EMAGE:1024 vs EMAGE:1024) the Jaccard value is 1 because the two input spatial regions are identical. Where it is compared to another pattern, the Jaccard Index will be less than one. If the Jaccard Index is 0, the two patterns do not intersect. The closer a Jaccard Index value is to 1, the more similar the two patterns are.
- The next step of the process is to perform hierarchical clustering of the numerical Jaccard Index values. This will place two assays near each other in the output files if they have similar Jaccard Index values across the board with all other assays in the set. Clustering is done using a version of a program (Cluster3.0) that was originally developed by Michael Eisen for analysing microarray expression data.
There are three output files for each comparison: (file extension .cdt, .gtr and.atr). In our current set-up, we have pre-calculated the clustering using the following parameters: un-centred correlation similarity metric followed by complete linkage clustering.
If you want to perform the clustering using other parameters, you can install the open source version of the cluster program and then download and read in the appropriate .txt Jaccard Index comparison file (which can be downloaded from the relevant EMAGE cluster analysis page).
| Viewing Option 1 An interactive tree viewer can be started straight from the web browser by clicking a button. You can click on the tree and view heat map representations of sites in the embryo that express the genes on each branch. The contributing raw data images for the selected branch may also be viewed. A slider tool is available to select multiple branches from the tree, and the tree can also be searched for examples of a gene of interest or EMAGE IDs: We recommend you increase the Java memory on your computer to load large trees (>300 branches) using this method. |
 |
|||
|
||||
| Viewing Option 2 The images are simply arranged (left to right) in rows according to the order (top to bottom) that they appear in the relatedness tree described above. This places the images into blocks that display similarities of expression pattern (but provides no information as to the tree structure). |
 |
|||
|
||||
Viewing Option 3 You can load the approriate .cdt, .gtr and.atr files (these can be downloaded from the relevant EMAGE cluster analysis page) into the original version of JavaTreeView that was developed by Michael Eisen for viewing the output of clustered microarray data. It can be downloaded here. Note that no images can be loaded into this version of JavaTreeView so it is of limited use for visual assessment of in situ expression data. |
|
|||

 icon to keep this page displayed.)