Confocal Microscopy
- How it works
- High resolution imaging
- Imaging large specimens
- Comparing confocal microscopy with OPT microscopy
- Movies
How it works
Conventional microscopy bathes an entire specimen in light, such that regions which are not in focus emit (or transmit) light which interferes with the clarity of the image - these regions are seen as the out-of-focus blur. One method to reduce interference from this out-of-focus light is to take a series of images at different focal depths and to feed them into an algorithm which uses assumptions about how light scatters through the specimen to digitally remove this "noise" from the data. This is known as deconvolution.
However, for many specimen (especially larger specimen) deconvolution cannot remove enough noise to produce a good 3D image. Confocal microscopy uses a simpler, but more effective method to remove the unwanted light - only a tiny point of the tissue is illuminated at any one moment, and the light from this point is focused onto a sinlge detector (only a small amount of light from other positions in the specimen reaches the detector). The technique therefore samples the tissue at a single point in space - effectively a 0-dimensional section through the specimen. (In practice, of course, the point is really a small 3-D volume.) Many individual points are rapidly scanned, building up a 1,2 or 3-dimensional image of the specimen.
High resolution imaging
Confocal microscopy is an excellent technique for imaging small specimen at high-resolution imaging, ie. the structure of groups of cells, or even the nuclei of single cells. However a good image can only be obtained up to a certain maximum depth through the tissue, and this depends on the specimen being scanned. Jacob Hecksher-Sorensen and myself have developed a technique for analysing gene expression (at the RNA level), which uses Fast Red as the final fluorescent product (Mech.Dev. 2001). Using this technique we have scanned down to a maximum depth of 70mm. However other staining protocols, such as fluorescently labelled antibodies, can achieve a depth of hundreds of microns. The more recently developed two-photon and multi-photon techniques, allow even greater depths. Any specimen which falls within this range can be reconstructed in 3D at very high quality.
Imaging large specimen
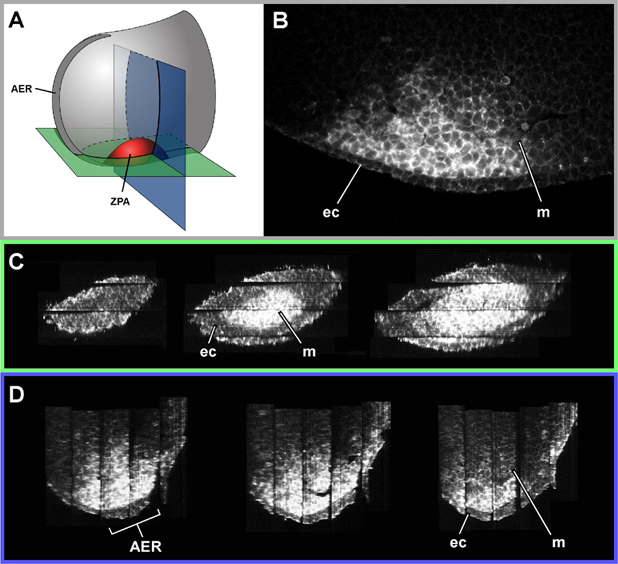
A maximum depth of a few hundred microns is not large enough to image many specimen intact. We have therefore explored the use of thick sections to get around this problem. Thick sections (50mm or larger) have a number of advantages over thin sections (see serial sections). In addition to the fact that there are far fewer to deal with, they also distort less (having more mechanical strength), and they retain information about 3D shapes (see figure below).
The following figure illustrates the use of confocal imaging of thick sections to reconstruct the expression pattern of Sonic hedgehog (Shh) in the ZPA (zone of polarising activity) in the developing mouse limb bud. Five thick sections were required to encompass the expression domain. Although the images display high resolution within each section (the shapes and positions of individual cells can be seens) the "joins" between sections are clearly visible in the full 3-D reconstruction.
Comparing confocal microscopy with OPT microscopy
We have previously used confocal imaging of thick sections to reconstruct the expression pattern of a gene in a complete embryo (Mech. Dev. 2001), and this represents a good comparison for the new OPT technique. For confocal analysis, a whole-mount in-situ hybridisation (WISH) for Shh was performed in an E9.5 mouse embryo. The embryo was then cut into 24 thick sections (70mm), and each section scanned under the confocal microscope. For OPT microscopy, WISH analysis of Sox9 expression was performed on an E11.5 mouse embryo (using the normal BCIP/NBT substrate). Since this embryo was two days older than the Shh embryo, it would have required the cutting of many more thick sections for analysis by confocal. The Sox9 embryo required no cutting, as OPT is a genuinely 3-D imaging technique and can cope with specimen up to ~15mm (see how it works).